Data Release - LA-UR-19-28211
Description
This outlines a collection of data released by LANL under LA-UR-19-28211 and available below. This data is memory usage data from three open clusters from late 2018 through early 2019.
Citation
The following datasets were released in conjunction with the following paper:
- Gagandeep Panwar, Da Zhang, Yihan Pang, Mai Dahshan, Nathan DeBardeleben, Binoy Ravindran, and Xun Jian. 2019. Quantifying Memory Underutilization in HPC Systems and Using it to Improve Performance via Architecture Support. In Proceedings of the 52nd Annual IEEE/ACM International Symposium on Microarchitecture (MICRO '52). ACM, New York, NY, USA, 821-835. DOI: https://doi.org/10.1145/3352460.3358267 (ACM Digital Library)
Overview
This entire collection of data has been released openly with the identifier LA-UR-19-28211. The data consists of 87.4GBs of (uncompressed) 19,678 JSON files. These JSON files contain memory usage statistics from three compute clusters at LANL: grizzly, badger, and snow. The data is relatively fine-grained (every 10 seconds, where records exist) for every node from each cluster, and identifies which job ID (numerical) used that memory. Since the job IDs are unique, one can see the parallel jobs running between multiple nodes. For instance, job ID 123 running on nodes 100, 101, and 102 will have separate memory utilization records for all three nodes for the time it was running.
Each archive has a detailed README which explains the data format and the cluster sizes, memory system sizes, etc. A brief sample of some trivial analysis from this data is at the bottom of the page. For a more detailed analysis, we encourage you to see the paper referenced above.
Data
| Cluster Name | Date Range |
file size |
file size (uncompressed) |
# of files | Link |
| Grizzly (dataset 0) | 11/1/18 - 11/27/18 | 1.6 GB | 12 GB | 1295 | grizzly0 |
| Grizzly (dataset 1) | 12/1/18 - 12/22/18 | 1.3 GB | 10 GB | 999 | grizzly1 |
| Grizzly (dataset 2) | 12/22/18 - 1/11/19 | 1.0 GB | 8.2 GB | 1001 | grizzly2 |
| Grizzly (dataset 3) | 1/12/19 - 2/5/19 | 1.3 GB | 9.7 GB | 1201 | grizzly3 |
| Grizzly (dataset 4) | 2/5/19 - 2/22/19 | 799 MB | 6.1 GB | 801 | grizzly4 |
| Grizzly (dataset 5) | 2/22/19 - 3/18/19 | 927 MB | 7.4 GB | 1167 | grizzly5 |
| Badger | 11/1/18 - 3/18/19 | 2.1 GB | 17 GB | 6607 | badger |
| Snow | 11/1/18 - 3/18/19 | 2.4 GB | 17 GB | 6607 | snow |
Samples
The following images are intended to give simple snapshots of the raw data. They are not a scientific analysis but may be useful to give a reader an idea what the data holds.
Hosts
Here we simply look at hostnames reporting data. This may be indicative of utilization of these hosts. When combined with job and time information (in the dataset, but not shown here), more interesting and advanced analytics could be performed. This first plot is from the grizzly0 dataset and we see most hosts reporting about the same number of records.

This can be contrasted with the badger dataset shown two different ways as follows:


Metrics
As the README files explain, the datasets contain meminfo.memfree and meminfo.active samples from every node at periodic intervals. Using this, one can get an idea of memory usage. For instance, the following plot shows a quick glimpse at the meminfo.active metric for the snow dataset.

For a more detailed analysis of the breakdown with nuances, we refer the reader to the paper referenced above.
JobIDs
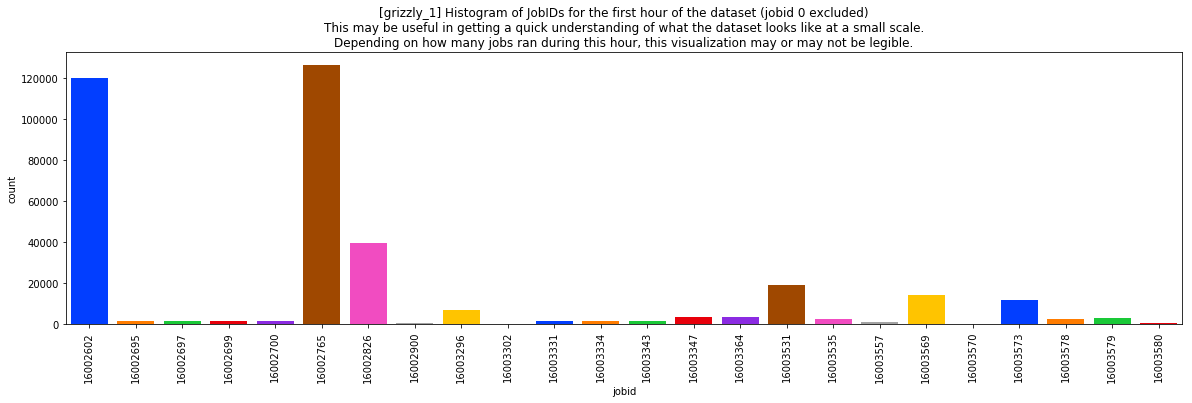
The datasets include memory usage data per node with the JobID consuming that memory. Since these systems are used for parallel computation, one can see the amount of memory consumed by parallel jobs and determine how many nodes that job ran on. The following plot shows a snapshot of the number of records in just the first hour of the grizzly1 dataset. This doesn't state how much memory was used, nor how many nodes these jobs ran on, just the number of records in the dataset. It is presented here (as mentioned earlier) to give the reader an idea of what is in the data.


